How to Set Up ELK Stack for Log Management
How to Set Up ELK Stack for Log Management
Application logs scattered across dozens of containers running on different nodes become impossible to search when you need to debug a production issue. Traditional approaches like SSH-ing into servers and grepping log files fail completely in containerized environments where containers are ephemeral and logs disappear when pods restart. Without centralized log management, debugging distributed systems devolves into guesswork.
This guide walks through setting up the ELK stack (Elasticsearch, Logstash, and Kibana) for centralized log management in production environments. You will learn the architecture decisions that prevent common performance problems, how to configure log shipping that survives network failures, and how to structure indices that remain searchable as log volume grows. The examples focus on Kubernetes deployments but the principles apply to any distributed system.
We cover the complete setup from initial installation through production-ready configurations including retention policies, index templates, and search optimization. The goal is a log management system that makes debugging faster, not one that creates a new operational burden.
Understanding ELK Stack Architecture
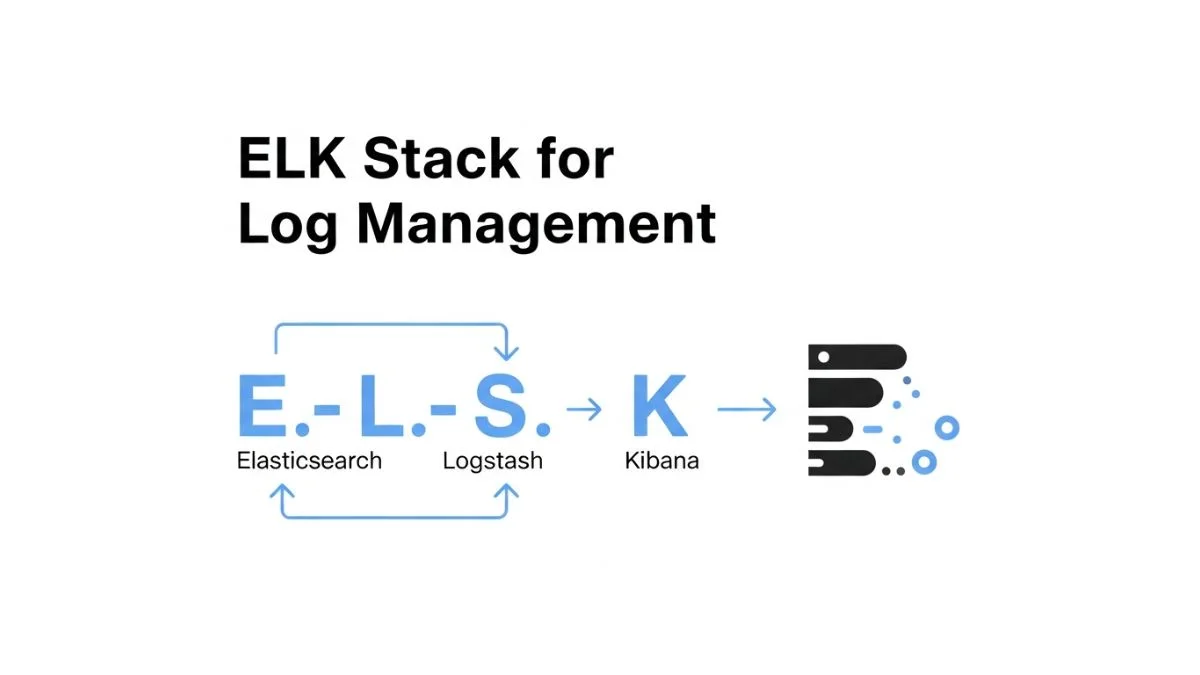
The ELK stack consists of three components that work together to collect, store, and visualize logs. Understanding what each component does and where it runs prevents the most common deployment mistakes.
Elasticsearch is the search and storage engine. It stores logs in indices, which are collections of similar documents that can be searched efficiently. Elasticsearch runs as a cluster of nodes that distribute data and query load. For production use, you need at least three nodes to maintain quorum and handle node failures without data loss.
Logstash processes and transforms logs before sending them to Elasticsearch. It parses unstructured log lines into structured fields, enriches logs with additional context, and can filter or drop logs before indexing. Logstash is optional in many deployments; simpler setups send logs directly to Elasticsearch using Filebeat or Fluentd.
Kibana provides the web interface for searching logs and creating visualizations. It connects to Elasticsearch and translates search queries and aggregations into the Elasticsearch Query DSL. Kibana is stateless and can run multiple replicas behind a load balancer.
The modern ELK stack also includes Beats, which are lightweight log shippers that run on each server or container to collect and forward logs. Filebeat is the most common Beat for shipping log files, while Metricbeat ships system and application metrics. Beats are more resource-efficient than running Logstash on every server.
Installing Elasticsearch Cluster
Elasticsearch requires careful resource allocation and configuration for production reliability. The default settings are designed for development and will cause problems under production load.
Install Elasticsearch on Kubernetes using the Elastic Cloud on Kubernetes (ECK) operator, which handles cluster lifecycle, upgrades, and certificate management:
kubectl create namespace logging

kubectl apply -f https://download.elastic.co/downloads/eck/2.10.0/crds.yaml
kubectl apply -f https://download.elastic.co/downloads/eck/2.10.0/operator.yaml

cat <<EOF | kubectl apply -f -
apiVersion: elasticsearch.k8s.elastic.co/v1
kind: Elasticsearch
metadata:
  name: logs
  namespace: logging
spec:
  version: 8.11.0
  nodeSets:
  - name: default
    count: 3
    config:
      node.store.allow_mmap: false
      xpack.security.authc.api_key.enabled: true
    podTemplate:
      spec:
        containers:
        - name: elasticsearch
          resources:
            requests:
              memory: 4Gi
              cpu: 2
            limits:
              memory: 4Gi
          env:
          - name: ES_JAVA_OPTS
            value: "-Xms2g -Xmx2g"
    volumeClaimTemplates:
    - metadata:
        name: elasticsearch-data
      spec:
        accessModes:
        - ReadWriteOnce
        resources:
          requests:
            storage: 100Gi
        storageClassName: fast-ssd
EOF
This configuration creates a three-node cluster with 4GB of memory per node and 100GB of storage per node. The critical setting is ES_JAVA_OPTS which sets the JVM heap size to 2GB, exactly half of the pod memory limit. Elasticsearch needs memory for both the JVM heap and operating system file caches; the 50-50 split is essential for performance.
The node.store.allow_mmap: false setting disables memory-mapped files, which is necessary when running in containers without the ability to modify system settings. This comes with a performance cost, but the alternative is Elasticsearch failing to start due to insufficient mmap counts.
Storage Considerations
Elasticsearch storage requirements depend on log volume and retention period. A typical application generating 1GB of logs per day needs approximately 30GB for a 30-day retention, but Elasticsearch adds overhead: indices consume more space than raw logs due to indexing data structures.
Use SSDs for Elasticsearch storage. Elasticsearch workloads are IO-intensive with random reads and writes, and the performance difference between SSDs and spinning disks is dramatic. On cloud providers, use provisioned IOPS volumes like AWS gp3 or Azure Premium SSD.
The storage class should support volume expansion. Log volume increases over time, and being able to expand volumes without rebuilding the cluster is operationally important:
apiVersion: storage.k8s.io/v1
kind: StorageClass
metadata:
  name: fast-ssd
provisioner: kubernetes.io/aws-ebs
parameters:
  type: gp3
  iops: "3000"
  throughput: "125"
allowVolumeExpansion: true
Cluster Health and Monitoring
After Elasticsearch starts, verify cluster health before proceeding:
kubectl port-forward -n logging svc/logs-es-http 9200:9200

# Get the elastic user password
PASSWORD=$(kubectl get secret -n logging logs-es-elastic-user -o go-template='{{.data.elastic | base64decode}}')

# Check cluster health
curl -k -u "elastic:$PASSWORD" https://localhost:9200/_cluster/health?pretty
A healthy cluster shows "status": "green" with all shards allocated. Yellow status means replica shards are unallocated, which is expected for a single-node development cluster but indicates a problem in production. Red status means primary shards are unallocated and data is inaccessible.
Deploying Filebeat for Log Collection
Filebeat runs as a DaemonSet to collect logs from every node in the cluster. It reads container logs from the node's filesystem and ships them to Elasticsearch or Logstash.
Create a Filebeat configuration that collects logs from all pods and enriches them with Kubernetes metadata:
apiVersion: v1
kind: ConfigMap
metadata:
  name: filebeat-config
  namespace: logging
data:
  filebeat.yml: |
    filebeat.inputs:
    - type: container
      paths:
        - /var/log/containers/*.log
      processors:
      - add_kubernetes_metadata:
          host: ${NODE_NAME}
          matchers:
          - logs_path:
              logs_path: "/var/log/containers/"
      - drop_event:
          when:
            or:
              - equals:
                  kubernetes.namespace: "kube-system"
              - equals:
                  kubernetes.namespace: "logging"

    output.elasticsearch:
      hosts: ['https://logs-es-http:9200']
      username: elastic
      password: ${ELASTICSEARCH_PASSWORD}
      ssl.certificate_authorities: ["/etc/elasticsearch/certs/ca.crt"]
      index: "filebeat-%{[agent.version]}-%{+yyyy.MM.dd}"

    setup.ilm.enabled: false
    setup.template.name: "filebeat"
    setup.template.pattern: "filebeat-*"
---
apiVersion: apps/v1
kind: DaemonSet
metadata:
  name: filebeat
  namespace: logging
spec:
  selector:
    matchLabels:
      app: filebeat
  template:
    metadata:
      labels:
        app: filebeat
    spec:
      serviceAccountName: filebeat
      containers:
      - name: filebeat
        image: docker.elastic.co/beats/filebeat:8.11.0
        args: [
          "-c", "/etc/filebeat.yml",
          "-e",
        ]
        env:
        - name: ELASTICSEARCH_PASSWORD
          valueFrom:
            secretKeyRef:
              name: logs-es-elastic-user
              key: elastic
        - name: NODE_NAME
          valueFrom:
            fieldRef:
              fieldPath: spec.nodeName
        resources:
          requests:
            memory: 200Mi
            cpu: 100m
          limits:
            memory: 500Mi
            cpu: 500m
        volumeMounts:
        - name: config
          mountPath: /etc/filebeat.yml
          subPath: filebeat.yml
        - name: varlogcontainers
          mountPath: /var/log/containers
          readOnly: true
        - name: varlogpods
          mountPath: /var/log/pods
          readOnly: true
        - name: es-certs
          mountPath: /etc/elasticsearch/certs
          readOnly: true
      volumes:
      - name: config
        configMap:
          name: filebeat-config
      - name: varlogcontainers
        hostPath:
          path: /var/log/containers
      - name: varlogpods
        hostPath:
          path: /var/log/pods
      - name: es-certs
        secret:
          secretName: logs-es-http-certs-public
The add_kubernetes_metadata processor enriches each log entry with pod name, namespace, labels, and annotations. This metadata is essential for filtering logs by service or environment. The drop_event processor excludes logs from kube-system and logging namespaces to avoid storing infrastructure logs that are typically high-volume and low-value.
The index name pattern includes the date, which creates daily indices. This is important for retention management: you can delete old indices by date without complex queries. The pattern filebeat-%{+yyyy.MM.dd} creates indices like filebeat-2026.03.28.
Creating the Required Service Account
Filebeat needs permission to access the Kubernetes API to fetch metadata:
apiVersion: v1
kind: ServiceAccount
metadata:
  name: filebeat
  namespace: logging
---
apiVersion: rbac.authorization.k8s.io/v1
kind: ClusterRole
metadata:
  name: filebeat
rules:
- apiGroups: [""]
  resources:
  - namespaces
  - pods
  - nodes
  verbs:
  - get
  - watch
  - list
---
apiVersion: rbac.authorization.k8s.io/v1
kind: ClusterRoleBinding
metadata:
  name: filebeat
subjects:
- kind: ServiceAccount
  name: filebeat
  namespace: logging
roleRef:
  kind: ClusterRole
  name: filebeat
  apiGroup: rbac.authorization.k8s.io
The ClusterRole grants read-only access to nodes, pods, and namespaces, which is the minimum required for metadata enrichment. More restrictive permissions would prevent Filebeat from correlating log files with pod information.
Configuring Logstash for Log Processing
Logstash is optional but valuable for complex log parsing and enrichment. If your application logs are already structured JSON, you can skip Logstash and send directly from Filebeat to Elasticsearch. If logs are unstructured text, Logstash extracts fields to make logs searchable.
A common pattern is parsing application logs with grok patterns to extract timestamps, log levels, and message content:
apiVersion: v1
kind: ConfigMap
metadata:
  name: logstash-config
  namespace: logging
data:
  logstash.yml: |
    http.host: "0.0.0.0"
    path.config: /usr/share/logstash/pipeline

  logstash.conf: |
    input {
      beats {
        port => 5044
      }
    }

    filter {
      # Parse JSON logs
      if [message] =~ /^\{.*\}$/ {
        json {
          source => "message"
          target => "parsed"
        }
      }

      # Parse common application log format: [LEVEL] timestamp - message
      grok {
        match => { "message" => "\[%{LOGLEVEL:log_level}\] %{TIMESTAMP_ISO8601:timestamp} - %{GREEDYDATA:log_message}" }
      }

      # Convert timestamp to @timestamp
      if [timestamp] {
        date {
          match => [ "timestamp", "ISO8601" ]
          target => "@timestamp"
        }
      }

      # Drop debug logs to reduce volume
      if [log_level] == "DEBUG" {
        drop { }
      }
    }

    output {
      elasticsearch {
        hosts => ["https://logs-es-http:9200"]
        user => "elastic"
        password => "${ELASTICSEARCH_PASSWORD}"
        ssl_certificate_authorities => ["/etc/elasticsearch/certs/ca.crt"]
        index => "app-logs-%{+YYYY.MM.dd}"
      }
    }
---
apiVersion: apps/v1
kind: Deployment
metadata:
  name: logstash
  namespace: logging
spec:
  replicas: 2
  selector:
    matchLabels:
      app: logstash
  template:
    metadata:
      labels:
        app: logstash
    spec:
      containers:
      - name: logstash
        image: docker.elastic.co/logstash/logstash:8.11.0
        ports:
        - containerPort: 5044
        env:
        - name: ELASTICSEARCH_PASSWORD
          valueFrom:
            secretKeyRef:
              name: logs-es-elastic-user
              key: elastic
        resources:
          requests:
            memory: 2Gi
            cpu: 1
          limits:
            memory: 2Gi
            cpu: 2
        volumeMounts:
        - name: config
          mountPath: /usr/share/logstash/config/logstash.yml
          subPath: logstash.yml
        - name: pipeline
          mountPath: /usr/share/logstash/pipeline/logstash.conf
          subPath: logstash.conf
        - name: es-certs
          mountPath: /etc/elasticsearch/certs
      volumes:
      - name: config
        configMap:
          name: logstash-config
      - name: pipeline
        configMap:
          name: logstash-config
      - name: es-certs
        secret:
          secretName: logs-es-http-certs-public
The grok pattern matches log lines and extracts named fields. The pattern \[%{LOGLEVEL:log_level}\] matches [INFO] or [ERROR] and captures it in a field called log_level. The TIMESTAMP_ISO8601 pattern matches ISO 8601 timestamps. The GREEDYDATA pattern captures everything else as the log message.
The date filter parses the extracted timestamp and sets it as the document's @timestamp field. This is crucial because Elasticsearch uses @timestamp for time-based queries and index lifecycle management. Without this, logs are indexed with the time Logstash processed them, not when the event actually occurred.
The drop filter removes debug logs entirely. This reduces storage costs and indexing load for logs that are rarely needed. An alternative is routing debug logs to a separate index with shorter retention.
Installing and Configuring Kibana
Kibana provides the search interface and visualization capabilities for your logs. The ECK operator can deploy Kibana automatically configured to connect to your Elasticsearch cluster:
cat <<EOF | kubectl apply -f -
apiVersion: kibana.k8s.elastic.co/v1
kind: Kibana
metadata:
  name: logs
  namespace: logging
spec:
  version: 8.11.0
  count: 1
  elasticsearchRef:
    name: logs
  http:
    tls:
      selfSignedCertificate:
        disabled: false
  podTemplate:
    spec:
      containers:
      - name: kibana
        resources:
          requests:
            memory: 1Gi
            cpu: 500m
          limits:
            memory: 2Gi
            cpu: 2
EOF
Access Kibana through port-forwarding for initial setup:
kubectl port-forward -n logging svc/logs-kb-http 5601:5601Navigate to https://localhost:5601 and log in with the elastic user and password retrieved earlier. The first step in Kibana is creating an index pattern that defines which indices to search.
Creating Index Patterns
An index pattern in Kibana maps to one or more Elasticsearch indices and defines which field contains the timestamp for time-based queries. Navigate to Stack Management > Index Patterns > Create Index Pattern.
For the daily filebeat indices, create a pattern filebeat-* which matches all indices starting with "filebeat-". Select @timestamp as the time field. This pattern now allows you to search all Filebeat logs across all days from a single search interface.
If you have multiple log sources or applications, create separate index patterns for each. This allows filtering by log source in the Discover interface and makes it easier to apply different retention policies to different log types.
Exploring Logs in Discover
The Discover interface is where you search and filter logs. Select your index pattern, adjust the time range, and you see all logs matching that pattern. The key to effective log searching is understanding the query syntax.
Kibana supports two query languages: Lucene query syntax and Kibana Query Language (KQL). KQL is more user-friendly for common cases:
Search for errors in a specific namespace:
kubernetes.namespace: "production" and log_level: "ERROR"

Search for logs containing a specific string:
message: "database connection failed"

Search for logs from a specific pod:
kubernetes.pod.name: "api-server-*"

Search for status codes in a range:
response_code >= 400 and response_code < 500
The filters panel on the left shows available fields and their top values. Click on a field value to add it as a filter. This interactive filtering is faster than typing queries for exploratory investigation.
Index Lifecycle Management and Retention
Logs accumulate continuously, and without retention policies, you will run out of storage. Index Lifecycle Management (ILM) automates the lifecycle of indices from creation through deletion.
Define an ILM policy that keeps logs for 30 days then deletes them:
PUT _ilm/policy/logs-policy
{
  "policy": {
    "phases": {
      "hot": {
        "min_age": "0ms",
        "actions": {
          "rollover": {
            "max_size": "50gb",
            "max_age": "1d"
          }
        }
      },
      "warm": {
        "min_age": "7d",
        "actions": {
          "forcemerge": {
            "max_num_segments": 1
          },
          "shrink": {
            "number_of_shards": 1
          }
        }
      },
      "delete": {
        "min_age": "30d",
        "actions": {
          "delete": {}
        }
      }
    }
  }
}
This policy defines three phases. The hot phase is for actively written indices and rolls over to a new index when the current one reaches 50GB or 1 day old. The warm phase starts after 7 days and optimizes indices for search by reducing segments and shards. The delete phase removes indices after 30 days.
Create an index template that applies this policy to all new indices matching a pattern:
PUT _index_template/logs-template
{
  "index_patterns": ["filebeat-*", "app-logs-*"],
  "template": {
    "settings": {
      "number_of_shards": 3,
      "number_of_replicas": 1,
      "index.lifecycle.name": "logs-policy",
      "index.lifecycle.rollover_alias": "logs"
    }
  }
}
This template configures all indices matching the pattern with 3 primary shards and 1 replica, and attaches the lifecycle policy. The number of shards should be based on index size and cluster size: too many shards waste resources, too few shards limit parallelism.
Optimizing Search Performance
As log volume grows, search performance degrades without proper optimization. Several strategies keep searches fast even with terabytes of logs.
Field Data Types and Mapping
Elasticsearch automatically detects field data types, but explicit mappings prevent mapping conflicts and enable optimizations. Define a mapping template for common log fields:
PUT _index_template/logs-mapping
{
  "index_patterns": ["filebeat-*", "app-logs-*"],
  "template": {
    "mappings": {
      "properties": {
        "log_level": {
          "type": "keyword"
        },
        "message": {
          "type": "text",
          "fields": {
            "keyword": {
              "type": "keyword",
              "ignore_above": 256
            }
          }
        },
        "response_code": {
          "type": "integer"
        },
        "duration_ms": {
          "type": "long"
        },
        "timestamp": {
          "type": "date"
        }
      }
    }
  }
}
The keyword type is for exact matching and aggregations, while text type is for full-text search. The message field is mapped as both: text for searching words within the message, and keyword for exact matching or aggregating by exact message content. The dual mapping increases storage but provides flexibility.
Reducing Cardinality
High cardinality fields like request IDs or user-specific data can make aggregations slow and memory-intensive. If you do not need to aggregate by these fields, map them as text only without the keyword sub-field, or do not index them at all:
"request_id": {
  "type": "keyword",
  "index": false,
  "doc_values": false
}
This stores the request_id value so it appears in search results, but does not index it for searching and does not create doc values for aggregations. If you only need request IDs for context when reading individual log entries, this saves significant storage and memory.
Time-Based Searches
Always specify a time range when searching. Searching across all indices is dramatically slower than searching a specific time period. For debugging a production issue that occurred two hours ago, search only the last three hours, not the last 30 days.
The time picker in Kibana defaults to the last 15 minutes, which is appropriate for real-time monitoring but too narrow for historical investigation. Adjust it based on the problem timeframe.
Alerting on Log Patterns
Kibana includes alerting capabilities that can notify you when specific log patterns appear. This complements metric-based alerting by catching issues that show up in logs before they affect metrics.
Create an alert for a high rate of error logs:
Navigate to: Stack Management > Rules and Connectors > Create Rule

Rule type: Elasticsearch query
Index: filebeat-*
Query: log_level: "ERROR"
Time field: @timestamp
Time window: 5 minutes
Threshold: count > 100

Action: Send to Slack/Email/PagerDuty
This alert fires when more than 100 error-level logs appear in a 5-minute window. The threshold should be tuned to your normal error rate: if you typically have 50 errors per 5 minutes, a threshold of 100 provides headroom for noise while catching significant increases.
More sophisticated alerts can use aggregations to detect anomalies. For example, alert when error rate suddenly doubles compared to the previous hour:
Query: log_level: "ERROR"
Threshold: current_window_count > (previous_window_count * 2)
This threshold-based alerting catches problems that would be missed by absolute thresholds. During low traffic periods, 100 errors might be catastrophic, while during peak traffic, 100 errors might be normal noise.
Security and Access Control
Logs often contain sensitive information: user IDs, transaction details, or API keys accidentally logged. Proper access control prevents unauthorized log access while still providing operational teams the visibility they need.
Elasticsearch supports role-based access control (RBAC) where you define roles with permissions to specific indices and assign those roles to users:
POST /_security/role/app-team-role
{
  "indices": [
    {
      "names": ["app-logs-*"],
      "privileges": ["read"]
    }
  ]
}

POST /_security/user/app-team-user
{
  "password": "secure-password-here",
  "roles": ["app-team-role"],
  "full_name": "Application Team User"
}
This creates a role that can read (but not write or delete) indices matching the app-logs-* pattern, and a user with that role. Teams can only see logs from their own applications, not infrastructure logs or other teams' application logs.
For Kubernetes environments, use namespace-based segregation. Create separate indices per namespace and grant teams access only to their namespace's indices. This aligns log access control with Kubernetes RBAC.
Troubleshooting Common Issues
ELK stack deployments encounter predictable problems during initial setup and operation. Understanding the symptoms and solutions prevents extended debugging sessions.
Logs Not Appearing in Elasticsearch
If Filebeat is running but logs do not appear in Elasticsearch, check Filebeat's connection to Elasticsearch:
kubectl logs -n logging daemonset/filebeat --tail=50Common errors include certificate verification failures, authentication errors, and connection timeouts. Certificate failures mean Filebeat does not trust the Elasticsearch certificate; verify that the ca.crt is correctly mounted. Authentication errors mean the password is wrong or the user lacks permissions. Connection timeouts indicate network policy or firewall blocking.
Verify logs are being collected by checking the Filebeat registry, which tracks which log files have been read:
kubectl exec -n logging daemonset/filebeat -- ls -la /usr/share/filebeat/data/registry/filebeat/If the registry is empty, Filebeat is not discovering log files, which means the volume mounts are incorrect or the log path pattern does not match actual log locations.
Elasticsearch Cluster Yellow or Red Status
Yellow status occurs when replica shards cannot be allocated. This is normal immediately after creating the cluster because replicas cannot be allocated to the same node as the primary. If status stays yellow after all nodes join, check shard allocation:
GET _cluster/allocation/explainThis shows why shards are unallocated. Common reasons include insufficient nodes (you have replicas but only one node), disk watermarks exceeded (nodes are out of disk space), or allocation filtering (you configured filters that prevent allocation).
Red status means primary shards are unallocated and data is unavailable. This is a severe problem indicating node failures or data corruption. Check cluster health and node status:
GET _cluster/health?level=indices
GET _cat/nodes?v
Slow Search Performance
Search slowness usually results from searching too much data or inefficient queries. Enable slow query logging to identify problematic queries:
PUT /filebeat-*/_settings
{
  "index.search.slowlog.threshold.query.warn": "2s",
  "index.search.slowlog.threshold.query.info": "1s"
}
This logs queries that take longer than 1 second at info level and longer than 2 seconds at warn level. Check Elasticsearch logs to see which queries are slow.
Force merging indices in the warm phase reduces segment count and improves search speed, but at the cost of increased CPU and IO during the merge operation. Schedule force merges during low-traffic periods.
FAQ
What is the difference between ELK and EFK stack?
ELK uses Logstash for log processing, while EFK replaces Logstash with Fluentd or Fluent Bit. Fluentd is lighter-weight and integrates better with Kubernetes through its native Kubernetes metadata plugin. ELK is more mature with more plugins and complex processing capabilities. For most Kubernetes deployments, EFK with Fluent Bit offers better resource efficiency, while ELK makes sense when you need Logstash's advanced processing features.
How much storage do I need for Elasticsearch?
Plan for approximately 1.5x your raw log volume due to indexing overhead. If you generate 10GB of raw logs per day and keep 30 days of retention, provision at least 450GB of storage. Add 30-50% buffer for growth and overhead. Monitor actual usage with the _cat/indices API to track real consumption and adjust. Different log types compress differently: structured JSON logs compress better than unstructured text logs.
Can I use the ELK stack with non-Kubernetes deployments?
Yes, the ELK stack works with any infrastructure. Instead of running Filebeat as a Kubernetes DaemonSet, install it as a system service on each server. The architecture remains the same: Filebeat ships logs to Elasticsearch or Logstash, and you search logs in Kibana. The main difference is configuration: you manually configure Filebeat on each server rather than deploying it declaratively through Kubernetes.
Should I run Elasticsearch on Kubernetes or use a managed service?
Managed services like AWS Elasticsearch Service or Elastic Cloud eliminate operational overhead but cost more and provide less control. Self-hosted on Kubernetes gives you full control and can be cheaper at scale, but requires expertise to operate reliably. For teams without Elasticsearch experience, start with a managed service. For teams with deep expertise or strict data locality requirements, self-hosted makes sense.
How do I handle logs during Elasticsearch downtime?
Filebeat includes a local queue that buffers logs when Elasticsearch is unavailable. Configure the queue size to handle expected downtime. If Elasticsearch is down longer than the queue can buffer, Filebeat stops reading new logs and resumes from where it left off when Elasticsearch recovers. For more resilience, configure Filebeat to send to Logstash, which has larger buffering capacity, or use a message queue like Kafka between Filebeat and Elasticsearch.
What is the difference between index patterns and index templates in Elasticsearch?
Index templates are Elasticsearch configurations that define settings and mappings for new indices matching a pattern. They control how data is stored and indexed. Index patterns are Kibana configurations that define which indices to search and visualize. An index template affects how Elasticsearch stores data, while an index pattern affects how Kibana displays it. You need both: templates for correct data storage, patterns for searching.
How do I upgrade the ELK stack without losing logs?
The ECK operator handles rolling upgrades automatically. It upgrades nodes one at a time, waiting for cluster health to return to green before proceeding to the next node. During the upgrade, the cluster remains available and continues indexing logs. Before upgrading, verify compatibility between Elasticsearch, Kibana, and Beats versions. Generally, Beats and Kibana should match or be one minor version behind Elasticsearch.
Can I search logs from multiple Kubernetes clusters in one Kibana instance?
Yes, configure Filebeat in each cluster to send logs to a centralized Elasticsearch cluster. Add a cluster label to logs from each cluster so you can filter by cluster in Kibana. Alternatively, run separate Elasticsearch instances per cluster and use Cross-Cluster Search in Kibana to query multiple clusters simultaneously. The first approach is simpler but creates a single point of failure; the second provides better isolation but more complexity.
How do I parse multi-line logs like Java stack traces?
Configure Filebeat's multiline pattern to combine related lines into a single event. For Java stack traces, lines starting with whitespace or "at" are continuation lines. Configure Filebeat with a multiline pattern that treats these as part of the previous log entry rather than separate entries. This ensures stack traces appear as complete messages in Elasticsearch rather than fragmented across multiple documents.
What is the cost difference between storing logs in Elasticsearch versus S3?
Elasticsearch provides fast searching but costs significantly more than object storage. S3 Standard costs about $0.023 per GB per month, while Elasticsearch on EBS costs $0.10+ per GB depending on volume type and instance costs. For long-term retention where active searching is not needed, archive logs to S3 after a short period in Elasticsearch. Use Elasticsearch for recent logs requiring frequent searching, and S3 for compliance retention.
Conclusion
Setting up the ELK stack for log management requires understanding the interaction between Elasticsearch storage, Filebeat collection, and Kibana visualization. The architecture decisions around index lifecycle, shard configuration, and resource allocation determine whether the system scales reliably or becomes an operational burden as log volume grows.
Start with the minimal viable setup: three-node Elasticsearch cluster, Filebeat DaemonSet for collection, and Kibana for search. Implement lifecycle management to prevent storage exhaustion. Add Logstash only if you need complex log parsing that Filebeat processors cannot handle. Monitor Elasticsearch cluster health and query performance to catch issues before they impact log availability.
The investment in proper log management pays off during production incidents when the ability to quickly search and correlate logs across services determines how fast you identify and resolve problems. Centralized logs transform debugging from guesswork into systematic investigation.