How to Monitor and Alert on Cloud Costs Effectively
How to Monitor and Alert on Cloud Costs
The moment most teams discover they've overspent on cloud infrastructure is when they receive an unexpectedly large bill at month-end—thousands of dollars too late to prevent the damage. A misconfigured autoscaling policy that spins up 50 instances instead of 5, a forgotten test environment running for weeks, or a single developer accidentally launching GPU instances in the wrong region can each generate $5,000-10,000 in waste before anyone notices. The fundamental problem isn't the cloud's pay-as-you-go model—it's that most organizations treat cost monitoring as an accounting exercise rather than an operational requirement.
This guide covers the specific monitoring infrastructure, alerting thresholds, and response workflows that catch cost anomalies in hours rather than weeks. Unlike generic "set up a budget" advice, you'll learn how to implement layered alerting that distinguishes between expected growth and actual waste, how to correlate cost spikes with specific engineering changes, and which metrics predict future cost problems before they materialize. The strategies work across AWS, Google Cloud, and Azure, with platform-specific implementation details where they differ.
The approach is organized by detection speed: real-time alerts for critical anomalies (catching runaway costs within hours), daily monitoring for gradual increases, and weekly analysis for optimization opportunities. Each layer serves a distinct purpose and requires different tooling and thresholds.
Establish Baseline Cost Patterns Before Setting Alerts
The biggest mistake in cost alerting is setting static thresholds without understanding your application's cost patterns. A 50% day-over-day increase might signal a serious problem for a stable application or represent expected growth during a product launch. Effective alerting requires establishing baselines: the expected cost range for different time periods, the relationship between business metrics and costs, and the seasonal patterns that affect usage.
Start by analyzing 60-90 days of historical cost data to identify patterns. Look for weekly cycles (weekday vs weekend usage), monthly patterns (month-end processing spikes), and correlations with business metrics (cost per active user, cost per API request). These patterns inform alert thresholds—a spike that exceeds normal weekend usage by 200% is anomalous, while the same spike during weekday peak hours might be expected growth.
The critical metrics to baseline include: total daily cost, cost by service (compute, storage, networking), cost by environment (production, staging, development), and cost per business metric (per user, per transaction, per API call). The last metric is most valuable—it normalizes costs against actual usage, making it easier to distinguish growth from waste.
Use statistical methods to set dynamic thresholds rather than fixed dollar amounts. Calculate the mean and standard deviation of daily costs over the past 30 days, then alert when current costs exceed mean + 2 standard deviations. This approach adapts to your actual usage patterns and reduces false positives from expected growth.
Implement Multi-Layer Alert Architecture
A single alerting threshold creates a false choice: set it too sensitive and drown in false positives, or set it too conservative and miss real problems. The solution is layered alerting with different thresholds, notification channels, and response expectations for different severity levels.
Critical alerts (page someone immediately) should trigger for anomalies that could generate $1,000+ of waste per day if unchecked. These include: daily costs exceeding 200% of the 30-day average, compute instance counts exceeding normal maximum by 3x, or any service showing 500%+ day-over-day cost increase. Critical alerts go to on-call engineers via PagerDuty or similar, expecting immediate investigation.
Warning alerts (notify during business hours) cover unusual patterns that warrant attention but aren't emergencies: daily costs exceeding 150% of average, services showing sustained week-over-week increases of 30%+, or non-production environments costing more than 30% of production. Warnings go to Slack or email, expecting investigation within 24 hours.
Informational alerts (weekly digest) capture optimization opportunities: resources with less than 20% utilization, storage growing faster than usage metrics, or services costing more this month than the prior quarter without corresponding feature changes. These enable proactive optimization without alert fatigue.
| Alert Severity | Threshold Example | Channel | Response Time |
|---|---|---|---|
| Critical | Daily cost exceeds $5,000 or 200% of baseline | PagerDuty | Immediate |
| Warning | Service cost up 50%+ week-over-week | Slack | Within 24 hours |
| Informational | Resources under 20% utilization | Email digest | Weekly review |
| Budget | 75%, 90%, 100% of monthly budget | Email + Slack | Plan for next month |
Set Up Native Cloud Provider Budgets and Alerts
Every major cloud provider offers built-in budget tracking and alerting. These native tools should be your first line of defense—they're free, integrated with billing data, and require minimal setup. The limitation is that they operate on billing data, which has 6-24 hour latency, so they catch problems quickly but not instantly.
In AWS, use AWS Budgets to set monthly spending limits with alerts at 75%, 90%, and 100% of budget. Configure separate budgets for different cost dimensions: total account spend, spend by service (EC2, RDS, Lambda separately), spend by linked account (if using AWS Organizations), and spend by cost allocation tag (by team or project). This granularity helps identify which specific area is overspending.
The advanced AWS Budgets feature is forecasted budgets: AWS predicts month-end costs based on current spending trajectory and alerts if the forecast exceeds budget. This gives you 1-2 weeks of advance warning rather than discovering overspend on day 30. Enable this for production accounts where predictable spending matters.
For Google Cloud, use Budget alerts in the Billing console with similar thresholds. Google Cloud's advantage is better programmatic control—you can trigger Cloud Functions when budgets exceed thresholds, enabling automated responses like shutting down non-essential resources or posting detailed breakdowns to Slack.
Azure uses Cost Management + Billing with budget alerts. Azure's unique feature is cost analysis by reservation coverage—it shows how much you could save with reserved instances based on actual usage patterns. This transforms cost monitoring from reactive (catching overspend) to proactive (identifying optimization opportunities).
Implement Real-Time Cost Monitoring with CloudWatch or Equivalent
Native budget alerts operate on billing data, which updates slowly. For real-time detection of cost anomalies, monitor the underlying usage metrics that drive costs: instance counts, request volumes, data transfer volumes, and service-specific metrics like Lambda invocations or database read/write operations.
On AWS, create CloudWatch alarms for metrics that correlate with costs. Critical metrics include: EC2 instance count by instance type (a spike from 10 to 100 m5.large instances signals a problem), EBS volume total provisioned storage (gradual growth is expected, sudden 5x increases aren't), Lambda total invocations per hour (sustained high rates might indicate an infinite loop), and NAT Gateway data processed (unexpected data transfer is expensive).
The pattern: establish baseline ranges for each metric over 30 days, then create CloudWatch alarms that trigger when current values exceed the baseline by 2-3 standard deviations. This catches anomalies within minutes rather than hours. The alarms should publish to SNS topics that trigger Lambda functions for automated analysis or post to Slack for immediate human review.
Here's an example CloudWatch alarm configuration for EC2 instance count monitoring using AWS CLI:
aws cloudwatch put-metric-alarm \
  --alarm-name high-ec2-instance-count \
  --alarm-description "Alert when EC2 count exceeds normal range" \
  --metric-name InstanceCount \
  --namespace AWS/EC2 \
  --statistic Sum \
  --period 300 \
  --evaluation-periods 2 \
  --threshold 50 \
  --comparison-operator GreaterThanThreshold \
  --alarm-actions arn:aws:sns:us-east-1:123456789:cost-alerts
For Google Cloud, use Cloud Monitoring (formerly Stackdriver) to track Compute Engine instance counts, Cloud Functions invocations, and BigQuery bytes processed. The advantage of Google Cloud's monitoring is better native integration with alerting policies that can trigger Cloud Functions for automated remediation—like automatically stopping instances that exceed expected counts.
Azure Monitor provides similar functionality with metric alerts. Azure's unique value is better support for multi-resource alerts—a single alert rule can monitor instance counts across all resource groups, simplifying management for large deployments.
Tag All Resources for Cost Attribution
Generic "AWS bill increased by $500" alerts are useless without knowing which team, project, or feature drove the increase. Cost allocation tags enable granular visibility: instead of knowing your EC2 costs increased 40%, you know that the data-pipeline team's development environment increased 200% while production stayed flat.
Implement a consistent tagging strategy with mandatory tags: Environment (production/staging/development), Team (engineering team or cost center), Project (feature or product area), and Owner (individual responsible for the resource). Apply these tags to all resources at creation time—retroactive tagging is painful and incomplete.
On AWS, activate cost allocation tags in the Billing console so they appear in Cost Explorer and billing reports. Then use Cost Explorer filtered by tag to create targeted budgets and alerts. You can set a $500/month budget for the data-team tag and receive alerts when that specific team's resources approach the limit, enabling team-level cost accountability.
The architectural enforcement mechanism: use infrastructure-as-code (Terraform, CloudFormation, Pulumi) that requires tags as mandatory parameters. This prevents untagged resources from being created. For existing resources, use automated tagging tools like AWS Tag Editor or Cloud Custodian to backfill missing tags based on resource naming patterns or organizational structure.
| Tag Name | Purpose | Example Values |
|---|---|---|
| Environment | Separate prod vs non-prod costs | production, staging, development |
| Team | Attribute costs to cost centers | platform, data, mobile, web |
| Project | Track feature-level costs | user-auth, payment-processing, analytics |
| Owner | Identify responsible individual | jane.doe, john.smith |
| CostCenter | Map to accounting systems | engineering, sales, marketing |
Build Custom Cost Dashboards for Daily Visibility
Native cloud provider cost interfaces (AWS Cost Explorer, Google Cloud Billing Reports, Azure Cost Management) are designed for monthly financial review, not daily operational monitoring. They update slowly, lack real-time data, and don't correlate costs with engineering events like deployments or configuration changes. Building custom dashboards solves these limitations.
The essential dashboard components include: current month-to-date spend vs forecast, daily cost trend for the past 30 days with baseline range overlay, top 10 services by cost with week-over-week change percentages, cost by environment with production vs non-production ratio, and cost per business metric (per user, per request) with trend line.
For AWS, use CloudWatch dashboards combined with custom metrics published from a Lambda function that queries Cost Explorer API daily. The Lambda runs on a schedule, fetches yesterday's costs broken down by service and tag, publishes them as CloudWatch custom metrics, and updates a CloudWatch dashboard. This creates near-real-time cost visibility updated every 24 hours.
Example Lambda function pattern for publishing cost metrics to CloudWatch:
import boto3
from datetime import datetime, timedelta

ce_client = boto3.client('ce')
cw_client = boto3.client('cloudwatch')

def lambda_handler(event, context):
    end_date = datetime.now().date()
    start_date = end_date - timedelta(days=1)

    response = ce_client.get_cost_and_usage(
        TimePeriod={
            'Start': str(start_date),
            'End': str(end_date)
        },
        Granularity='DAILY',
        Metrics=['UnblendedCost'],
        GroupBy=[{'Type': 'DIMENSION', 'Key': 'SERVICE'}]
    )

    for group in response['ResultsByTime'][0]['Groups']:
        service = group['Keys'][0]
        cost = float(group['Metrics']['UnblendedCost']['Amount'])

        cw_client.put_metric_data(
            Namespace='CustomCostMetrics',
            MetricData=[{
                'MetricName': f'{service}_Cost',
                'Value': cost,
                'Unit': 'None',
                'Timestamp': start_date
            }]
        )
For Google Cloud, use Cloud Monitoring dashboards with custom metrics from BigQuery exports of billing data. Google Cloud automatically exports detailed billing data to BigQuery, which you can query to create custom aggregations and metrics. Schedule a Cloud Function to run these queries daily and publish results to Cloud Monitoring for dashboard visualization.
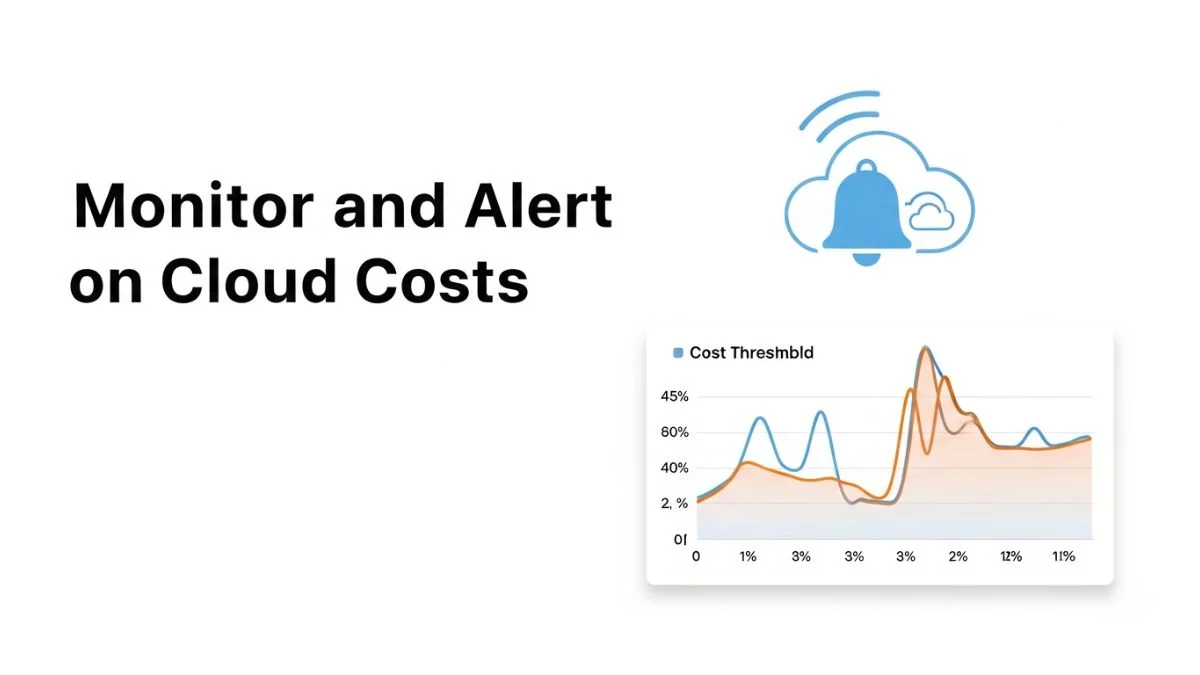
The visualization that matters most: cost trend with baseline and anomaly bands. Show daily costs as a line chart with the 30-day rolling average as a baseline, 1 and 2 standard deviation bands as shaded regions, and highlight days where actual costs exceeded 2 standard deviations. This immediately shows which days were anomalous and deserve investigation.
Correlate Cost Spikes with Engineering Events
A cost spike is only actionable if you can identify what caused it. The most common causes are infrastructure changes: deployments that introduce inefficient code, configuration changes that increase resource consumption, or autoscaling policies that overreact to load spikes. Correlating costs with engineering events enables root cause analysis.
The implementation: create a unified timeline that shows both cost metrics and engineering events. Engineering events include deployments (from CI/CD pipelines), infrastructure changes (from Terraform/CloudFormation), configuration updates (from configuration management tools), and incident responses (from PagerDuty or incident management systems).
For AWS, publish deployment events as custom CloudWatch events, then display them as annotations on your cost dashboard. When you see a cost spike on Tuesday at 2pm, the dashboard shows that a deployment occurred at 1:45pm—immediately identifying the probable cause. The pattern works across cloud providers: publish events to the monitoring system's event stream, then overlay them on cost charts.
Example of publishing deployment events to CloudWatch:
aws events put-events --entries '[
  {
    "Source": "ci-cd.pipeline",
    "DetailType": "Deployment",
    "Detail": "{\"service\": \"api-backend\", \"environment\": \"production\", \"version\": \"v2.3.1\"}",
    "Time": "2024-03-28T13:45:00Z"
  }
]'
The more sophisticated version: automatically detect cost anomalies, identify recent deployments or infrastructure changes, and post detailed reports to Slack with probable causes and responsible owners based on tags. This transforms reactive cost monitoring into proactive root cause analysis.
Use Third-Party Tools for Advanced Cost Intelligence
Native cloud provider tools handle basic monitoring, but third-party platforms offer advanced capabilities: anomaly detection using machine learning, multi-cloud unified dashboards, automated optimization recommendations, and FinOps workflows for cost accountability. These tools are worth their cost (typically 1-3% of cloud spend) once you're spending $5,000+/month on cloud infrastructure.
CloudHealth by VMware provides comprehensive cost monitoring across AWS, Azure, and Google Cloud with unified dashboards, automated policies (like shutting down idle resources), and detailed rightsizing recommendations. The strength is governance: you can set policies that automatically tag untagged resources, terminate instances that violate cost policies, or block deployment of expensive instance types without approval.
Datadog Cloud Cost Management integrates cost monitoring with infrastructure observability. The unique value: correlating costs with performance metrics and application traces. You can see that a microservice's costs increased 40% while its latency decreased 30%—indicating the cost increase bought valuable performance, versus a cost increase with no performance benefit signaling waste.
CloudZero provides cost-per-customer analytics for SaaS applications. It maps infrastructure costs to individual customers or features, enabling you to identify which customers are unprofitable, which features cost more to operate than they generate in revenue, and how pricing changes would impact margins. This transforms cost monitoring from operational efficiency into business intelligence.
| Tool | Best For | Pricing Model |
|---|---|---|
| CloudHealth | Multi-cloud governance and policy enforcement | ~2% of cloud spend |
| Datadog Cloud Cost | Correlating costs with performance and traces | Included with Datadog subscription |
| CloudZero | Cost-per-customer analytics for SaaS | Custom pricing based on spend |
| Kubecost | Kubernetes cluster cost monitoring and allocation | Free tier, $50-500/month for advanced features |
| Infracost | Cost estimates in pull requests for IaC changes | Free for open source, $50+/month for teams |
For Kubernetes-specific cost monitoring, Kubecost is purpose-built to attribute cluster costs to namespaces, deployments, and labels. It shows exactly which microservices or teams consume the most cluster resources, enabling fine-grained cost allocation that native cloud provider tools can't provide for containerized workloads.
Implement Automated Remediation for Common Cost Wastes
Monitoring and alerting identify problems, but automated remediation prevents them from accumulating costs. The highest-ROI automations target predictable waste patterns: idle development environments, unattached storage volumes, and forgotten test resources that run indefinitely.
Use cloud-native automation tools: AWS Systems Manager Automation for AWS, Cloud Scheduler with Cloud Functions for Google Cloud, or Azure Automation for Azure. The pattern: schedule automated jobs that identify wasteful resources based on tags and usage metrics, then take corrective action like stopping instances or posting notifications to owners.
Common automation targets include: EC2 instances tagged "environment:development" that run outside business hours (auto-stop nightly, auto-start mornings), EBS volumes unattached for 7+ days (snapshot and delete), RDS instances with less than 10% CPU utilization for 14+ days (alert owner for rightsizing), and S3 buckets with outdated lifecycle policies (apply intelligent tiering).
Here's an example AWS Lambda function that stops development instances outside business hours:
import boto3
from datetime import datetime

ec2 = boto3.client('ec2')

def lambda_handler(event, context):
    # Run this at 7pm weekdays
    instances = ec2.describe_instances(
        Filters=[
            {'Name': 'tag:Environment', 'Values': ['development']},
            {'Name': 'instance-state-name', 'Values': ['running']}
        ]
    )

    instance_ids = []
    for reservation in instances['Reservations']:
        for instance in reservation['Instances']:
            instance_ids.append(instance['InstanceId'])

    if instance_ids:
        ec2.stop_instances(InstanceIds=instance_ids)
        print(f'Stopped {len(instance_ids)} development instances')

    return {'statusCode': 200, 'body': 'Success'}
The key to successful automation: start with notifications before taking destructive actions. Send weekly reports of "resources we would delete" for 2-3 weeks, giving teams time to correct tagging or justify keeping resources. After the grace period, enable actual deletion for resources that remain idle.
Establish Cost Review Cadence and Accountability
Technology alone doesn't control costs—organizational processes and accountability do. Regular cost reviews with clear ownership ensure that monitoring alerts translate into corrective action. The review cadence depends on spending level: daily for organizations spending $50,000+/month, weekly for $5,000-50,000/month, monthly for lower spending.
The weekly cost review meeting should cover: comparison of actual vs budgeted costs by team and service, investigation of anomalies and spikes from the past week, status updates on optimization initiatives, and review of top 10 resources by cost with justification for each. Keep it focused—30 minutes maximum with pre-work required.
Cost accountability requires mapping cloud spending to organizational structure. Each engineering team should have a cost budget and be responsible for staying within it. Use cost allocation tags to break down spending by team, then publish monthly cost reports showing each team's spend vs budget. Make this visible—post it in shared channels so cost consciousness becomes part of engineering culture.
The organizational pattern that works: each team has a designated "cost champion" responsible for monitoring their team's cloud costs, investigating anomalies, and driving optimization efforts. The cost champion attends monthly FinOps meetings where teams share cost-saving strategies and learn from each other's optimization successes.
FAQ Section
How much does it cost to implement comprehensive cloud cost monitoring?
Native cloud provider tools (AWS Budgets, Google Cloud Billing Alerts, Azure Cost Management) are completely free but have limited functionality. Third-party platforms typically cost 1-3% of your monthly cloud spend—so if you're spending $10,000/month on infrastructure, expect $100-300/month for monitoring tools. Custom dashboards built in-house require engineering time but minimal ongoing costs. Most organizations should start with free native tools, then add third-party platforms once spending exceeds $5,000/month.
What's the right threshold for a cost spike alert—50%, 100%, 200%?
There's no universal threshold because it depends on your baseline variability and tolerance for false positives. For stable applications with predictable load, alert at 150% of baseline. For applications with high variability (viral social apps, seasonal businesses), use 200-300% to avoid alert fatigue. The best approach is statistical: alert when costs exceed mean + 2 standard deviations calculated from 30 days of history. This adapts to your specific usage patterns.
Should development and staging environments have the same cost monitoring as production?
Yes for detection, no for alerting thresholds. Monitor all environments equally because development environments often become expensive accidentally (developers testing at scale, forgotten load tests running overnight). But use different alert thresholds: production alerts should trigger on smaller increases because uptime matters, while development alerts can be more relaxed. Critical difference: enable automated shutdown for development resources outside business hours.
How quickly can cost monitoring tools detect a problem—minutes, hours, or days?
It depends on the data source. Monitoring based on CloudWatch metrics (instance counts, Lambda invocations) detects problems in minutes. Monitoring based on billing data (AWS Cost Explorer, billing APIs) has 6-24 hour latency. For catching runaway costs immediately, use metric-based monitoring. For understanding overall spending trends and monthly budgets, billing-based monitoring is sufficient.
What's the most common cause of unexpected cloud cost spikes?
Autoscaling misconfiguration is the top cause—a policy that scales up aggressively but never scales down, or scaling limits set too high (max 500 instances when you never need more than 50). Second most common: developers testing in production-scale environments without realizing costs. Third: data transfer costs from architectural changes that move data between regions or out to the internet. These three patterns account for 60-70% of cost spike incidents.
How do I monitor costs for Kubernetes clusters where individual pods aren't tagged?
Use Kubernetes-specific cost monitoring tools like Kubecost or OpenCost that instrument the cluster to track resource usage by namespace, deployment, label, and pod. These tools allocate node costs proportionally based on actual CPU and memory consumption, providing granular visibility that native cloud provider tools can't match. For basic monitoring without additional tools, tag all cluster nodes with team/project identifiers and track costs at node level.
Can I automatically stop or terminate resources that exceed cost thresholds?
Technically yes, but you shouldn't except for clearly defined non-production scenarios. Automatically terminating resources based on cost thresholds risks disrupting legitimate business operations. The safe approach: automatically stop development/staging resources during off-hours, require manual approval before terminating anything, and implement notification+delay periods (warn owner, wait 7 days, then delete if unaddressed). For production, alert and investigate rather than taking automated actions.
How do I set realistic cost budgets when my application is growing unpredictably?
Tie budgets to business metrics rather than fixed dollar amounts. Set a budget of "$X per active user" or "$Y per 1 million API requests" rather than "$Z total monthly spend." This approach makes budgets scale with actual usage while still alerting on efficiency regressions. Recalculate these per-unit budgets quarterly based on historical trends and optimization efforts. As you find efficiencies, the per-unit budget should decrease even as total spending increases.
What's the ROI of investing engineering time in cost monitoring versus just accepting higher cloud bills?
The median organization wastes 30-40% of cloud spending on idle resources, overprovisioned instances, and inefficient architectures. If you're spending $10,000/month, that's $3,000-4,000/month of preventable waste. Implementing comprehensive monitoring and optimization processes might require 40-80 hours of initial engineering time plus 5-10 hours monthly ongoing. The ROI breakeven is typically 1-2 months for organizations spending $5,000+/month on cloud infrastructure.
Should I alert on absolute dollar amounts or percentage changes?
Use both for different purposes. Percentage changes catch anomalies (200% increase overnight signals a problem regardless of absolute spend). Absolute amounts catch threshold crossings that matter to business ($10,000/day in costs requires executive attention even if it's only a 20% increase). The ideal alert setup combines: percentage-based anomaly detection for engineering teams, and absolute threshold alerts for finance teams tracking budget compliance.
Conclusion
Effective cloud cost monitoring isn't about setting up a single budget alert and hoping for the best—it's about building a layered detection system that catches different types of cost problems at different timescales. Start with native cloud provider budgets for monthly oversight, add metric-based alerts for real-time anomaly detection, implement custom dashboards for daily visibility, and establish organizational processes for regular cost reviews.
The monitoring infrastructure matters less than the response workflow. The best monitoring system in the world is worthless if alerts go to unmonitored channels or generate no corrective action. Define clear ownership, establish response procedures for different alert severities, and create feedback loops where cost learnings inform architecture decisions and development practices.
Begin with the fundamentals: set up budgets with 75%/90%/100% alerts, tag all resources consistently, and create a weekly cost review ritual. These baseline practices catch the majority of cost waste—the advanced techniques and third-party tools can wait until you've mastered the basics and your spending justifies the investment.